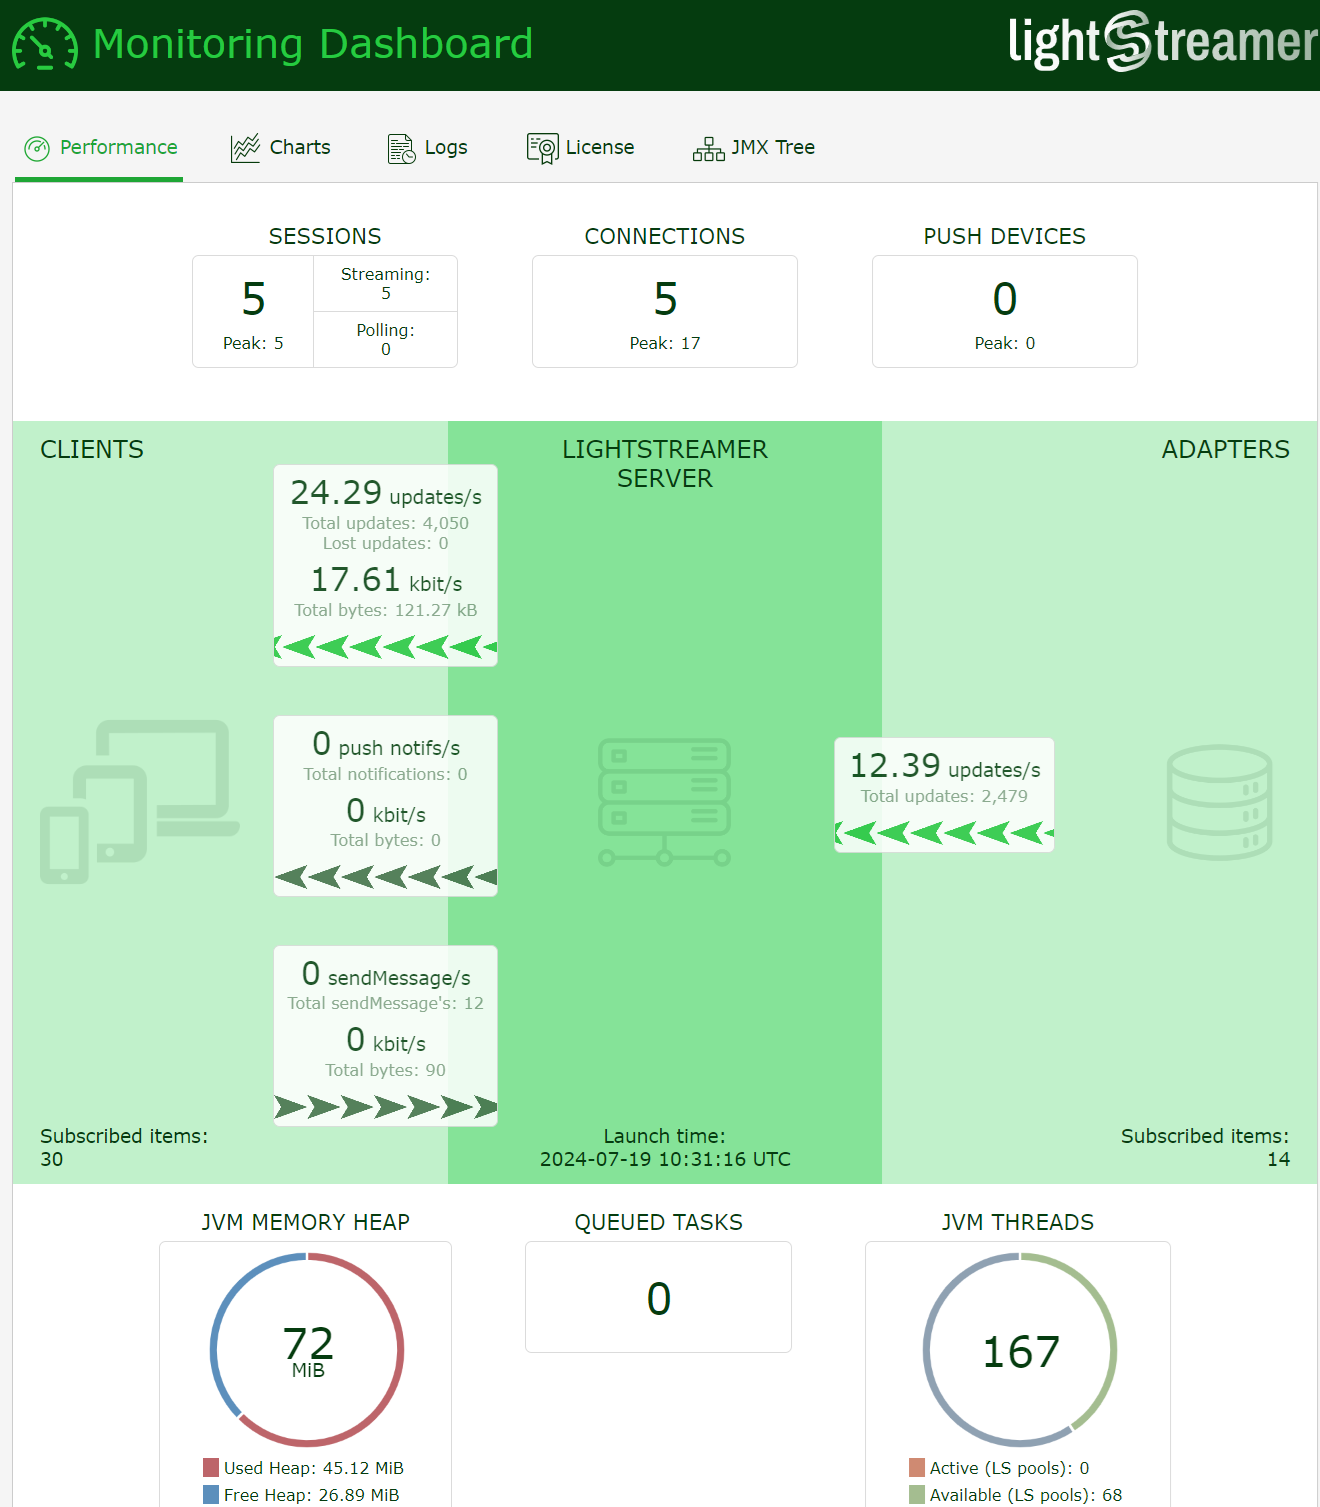
Embedded in the factory download of the Lightstreamer server there is a Monitoring Dashboard ready for use. It is configured to work out of the box and provides many real-time metrics and statistics on the behavior of the Lightstreamer Server.

But we are aware that this solution, which can be considered very useful in the initial development phase and for basic uses, indeed shows some limitations in real production environments.
Maybe two of the main limitations of the factory Monitoring Dashboard are:
- Currently, Lightstreamer does not provide out of the box a consolidated dashboard in order to have the aggregated data of multiple Lightstreamer instances; for example the aggregate data of an entire cluster of Lightstreamer instances.
- There is no possibility of configuring or customizing the dashboard in order to build your own customized tabs and panels by picking up from the numerous metrics available.
The recommended solution to overcome these limitations is to leverage the most popular third-party tools available to collect the many metrics available in Lightstreamer and build your own customized dashboard.
Basically, you have two options to export metrics from a Lightstreamer server in order to feed up those tools.
Leveraging the Lightstreamer loggers
LightstreamerMonitorText logger logs statistics with a human-readable syntax while LightstreamerMonitorTAB logger logs with a CSV syntax ideal to be imported into databases, spreadsheets, and similar tools.
The frequency of the samples produced by the internal monitoring system is based on the level specified for each logger (in LS_HOME/conf/lightstreamer_log_conf.xml); in particular:
at TRACE level, all samples are logged (suggested);
at DEBUG level, one sample out of 10 is logged;
at INFO level, one sample out of 60 is logged;
at a higher level, no log is produced.
This is indicated for historical analyses. For example, you could redirect the LightstreamerMonitorTAB logger to a dedicated daily-rolling file and upload the metrics every day to a proper database.
JMX API interface
The JMX API interface (it is an optional feature that could not be included in your license) exposes the most complete set of information and can be also consulted via a specific tab in the factory Monitoring Dashboard. But was designed primarily to be integrated with custom or third-party monitoring systems via the JMXMP or RMI protocols. For complete documentation of the interface please refer here.
Lightstreamer + Prometheus + Grafana
We now focus on a solution that provides the export of the metrics via Lighstreamer’s JMX interface and integrates tools such as Prometheus and Grafana. We are aware of pretty good results with such a strategy and several success stories among our customers. We have also used the integration with these tools for internal projects too.
Prometheus is a free software application used for event monitoring and alerting. It records real-time metrics in a time series database built using a HTTP pull model, with flexible queries and real-time alerting.
Grafana is a multi-platform open-source analytics and interactive visualization web application. It provides charts, graphs, and alerts for the web when connected to supported data sources.
Using both in combination, Prometheus to store the data and Grafana to display the dashboards, has often turned out to be a winning solution: relatively simple to implement and with excellent results.
The missing piece to make this integration really simple and immediate was the component that exported the data from the Lightstreamer JMX interface and made it available for consumption by Prometheus.
Well, we just published on GitHub the Lightstreamer Metrics Exporter Adapter Set, an Adapter Set ready to be deployed into Lightstreamer server to export metrics for Prometheus polls.
Lightstreamer Metrics Exporter Adapter Set
This metrics exporter is intended to be run as a Lightsteamer in-process adapter, exposing Prometheus metrics using a plain Java HttpServer and serving metrics of the local JVM.
The code (in Java language) leverages the Prometheus Java Client and includes the instrumentation logic in a Metadata Adapter class. A custom collector is implemented to proxy metrics coming from local MBeans with a one-to-one mapping between MBean attribute and Prometheus metric. The format of a metric is something like this:
<server_name>_<bean_name>_<attribute_name>{beanpropertyName1=”beanPropertyValue1″, …}: value
Examples:
lightstreamer_Stream_CumulItemUpdates 381.0
lightstreamer_ThreadPool_Throughput{name=”EVENTS”,} 4.0
lightstreamer_ThreadPool_Throughput{name=”PUMP”,} 5.997
lightstreamer_ThreadPool_Throughput{name=”SNAPSHOT”,} 0.0
lightstreamer_DataAdapter_InboundEventFrequency{AdapterSetName=”WELCOME”,DataAdapterName=”CHAT”,} 0.0
lightstreamer_DataAdapter_InboundEventFrequency{AdapterSetName=”DEMO”,DataAdapterName=”QUOTE_ADAPTER”,} 1.5
As a side note I want to point out that this is a very unconventional use of an Adapter Set; as it this case is not provided to support client sessions but just as a trick to implement some sort of plug-in.
A step-by-step tutorial
Below is a step-by-step tutorial with the aim of illustrating the concepts previously exposed and finally obtaining a graph in Grafana with the number of concurrent sessions over time of your local Lightstreamer instance.
0. If you don’t already have a Lightstreamer server installed locally; download it from here and follow the instructions in the guide: GETTING_STARTED.TXT
1. Download the deploy.zip from Lightstreamer Metrics Exporter Adapter Set (here)
2. Unzip and copy the metrics_exporter folder under <LS_HOME>/adapters/
3. Restart Lightstreamer server
4. Download and unzip Prometheus
5. Add the following job definition to the scrape_configs section in your prometheus.yml and restart your Prometheus instance
- job_name:       'Lightstreamer local'

    # Override the global default and scrape targets from this job every 5 seconds.
    scrape_interval: 5s

    static_configs:
      - targets: ['localhost:9876']
        labels:
          group: 'Lightstreamer'
6. Download and install Grafana
7. Create a specific Prometheus data source in the Grafana configuration section: select “Prometheus” as the type and set the appropriate Prometheus server URL “http://localhost:9090”. Click “Save & Test” to save the new data source.
8. Create a new dashboard; add a new panel; select as data source the one created in the previous step; in the “Metrics browser” input text choose lightstreamer_Resource_CurrentSessions and save:

References
For more information on the topics discussed in this tutorial, please refer to:
- Lightstreamer Metrics Exporter Adapter Set {https://github.com/Lightstreamer/Lightstreamer-utility-MetricsExporter-Adapter}
- Prometheus {https://prometheus.io/}
- Grafana {https://grafana.com/}


